Mars: Spectral Analysis, Denoising, and Landing Site Selection
The Mission and The Team
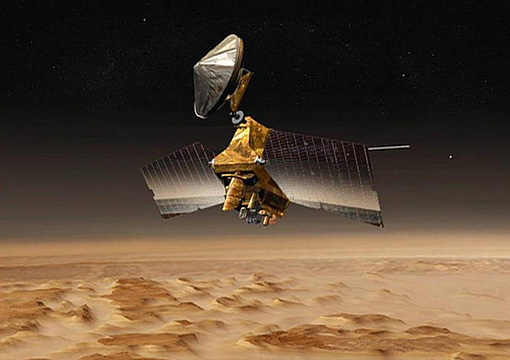
Real quick, let's get through the acronym soup. From 2007 - 2009, I worked with SETI (Search for Extra Terrestrial Intelligent) / NASA(National Aeronautics and Space Administration) on the CRISM (Compact Reconnaissance Imaging Spectrometer for Mars) team. CRISM is a hyperspectral camera on MRO (the Mars Reconnaissance Orbiter), a satellite orbiting Mars. I contributed to the data processing pipeline, analysis, and simulation efforts under the guidance of my mentors, Janice Bishop and Mario Parente.
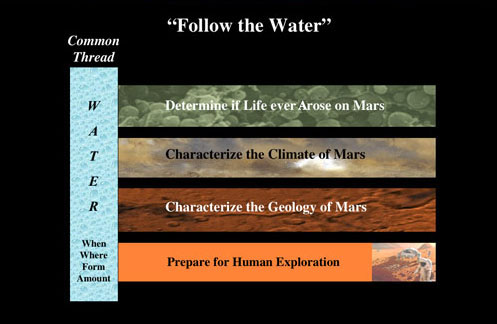
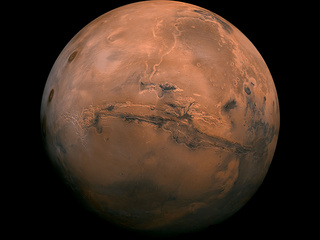
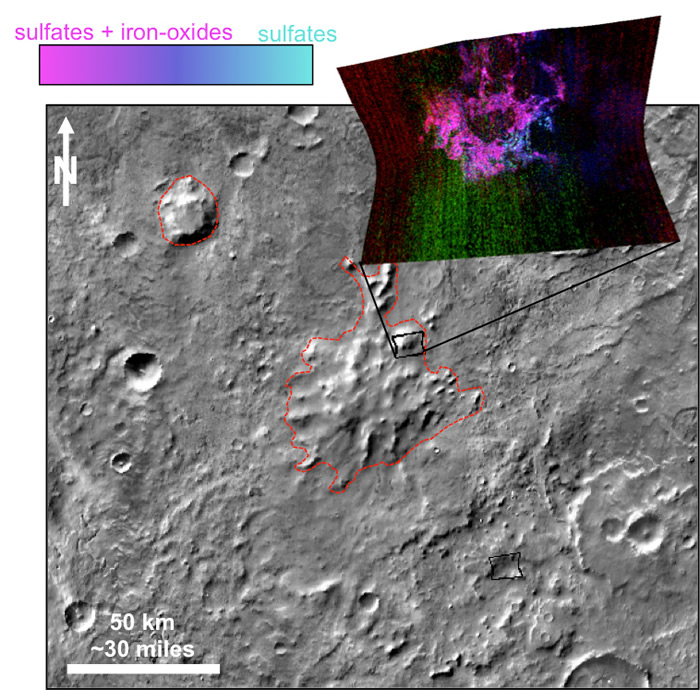
Our team was interested in a few things. Our explicit mission was to study the geology and climate of Mars, and provide Reconnaissance to select future landing sites. Interesting spots were usually dictated by the minerals that were present, particularly minerals that only form in the presence of water. While no one at SETI actually thinks there is life on Mars, it is the only other planet that is both close enough to study, and which may have had the appropriate conditions for life (as we know it) to form. We searched for hydrated mineralogy, which would suggest the presence of water some time in the last few billion years.
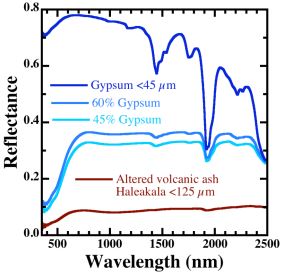
Additionally, we were interested in the scientific discoveries made along the way. The team published a lot of work in planetary geology, chemistry, and remote sensing. The remote sensing was my focus. I published on the data analysis pipeline, denoising methods, and simulation tools. I even joined in a bit of the chemistry, presenting one poster on spectral signatures for different mineral mixtures and grain sizes. I need to look up those papers
My Contributions
Background
First off, a little background about hyperspectral data. Most images that you look at are either grayscale (1 color channel), or RGB (3 color channels). CRISM takes hyperspectral data in 544 channels, make the color dimension very rich. Just using red, green, and blue, we can distinguish between all sorts of things. If you see in 544 colors, you can learn a lot. In fact, you can often tell what kind of minerals are present, and sometimes even determine the grain sizes of dirt, and the amount of water that was present when the minerals formed. With so many color channels, it was helpful to think of the data in 3D (height, width, channel), and we refers to hyperspectral images as data cubes.
Atmosphere and Noise
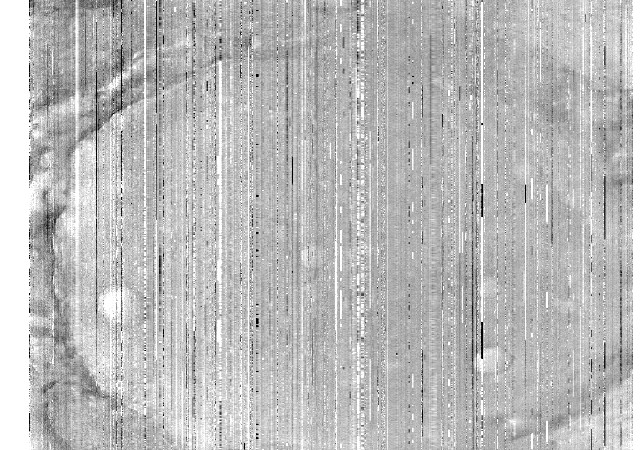
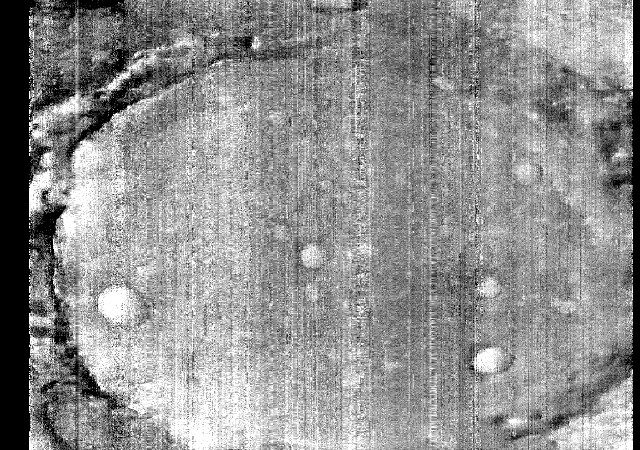
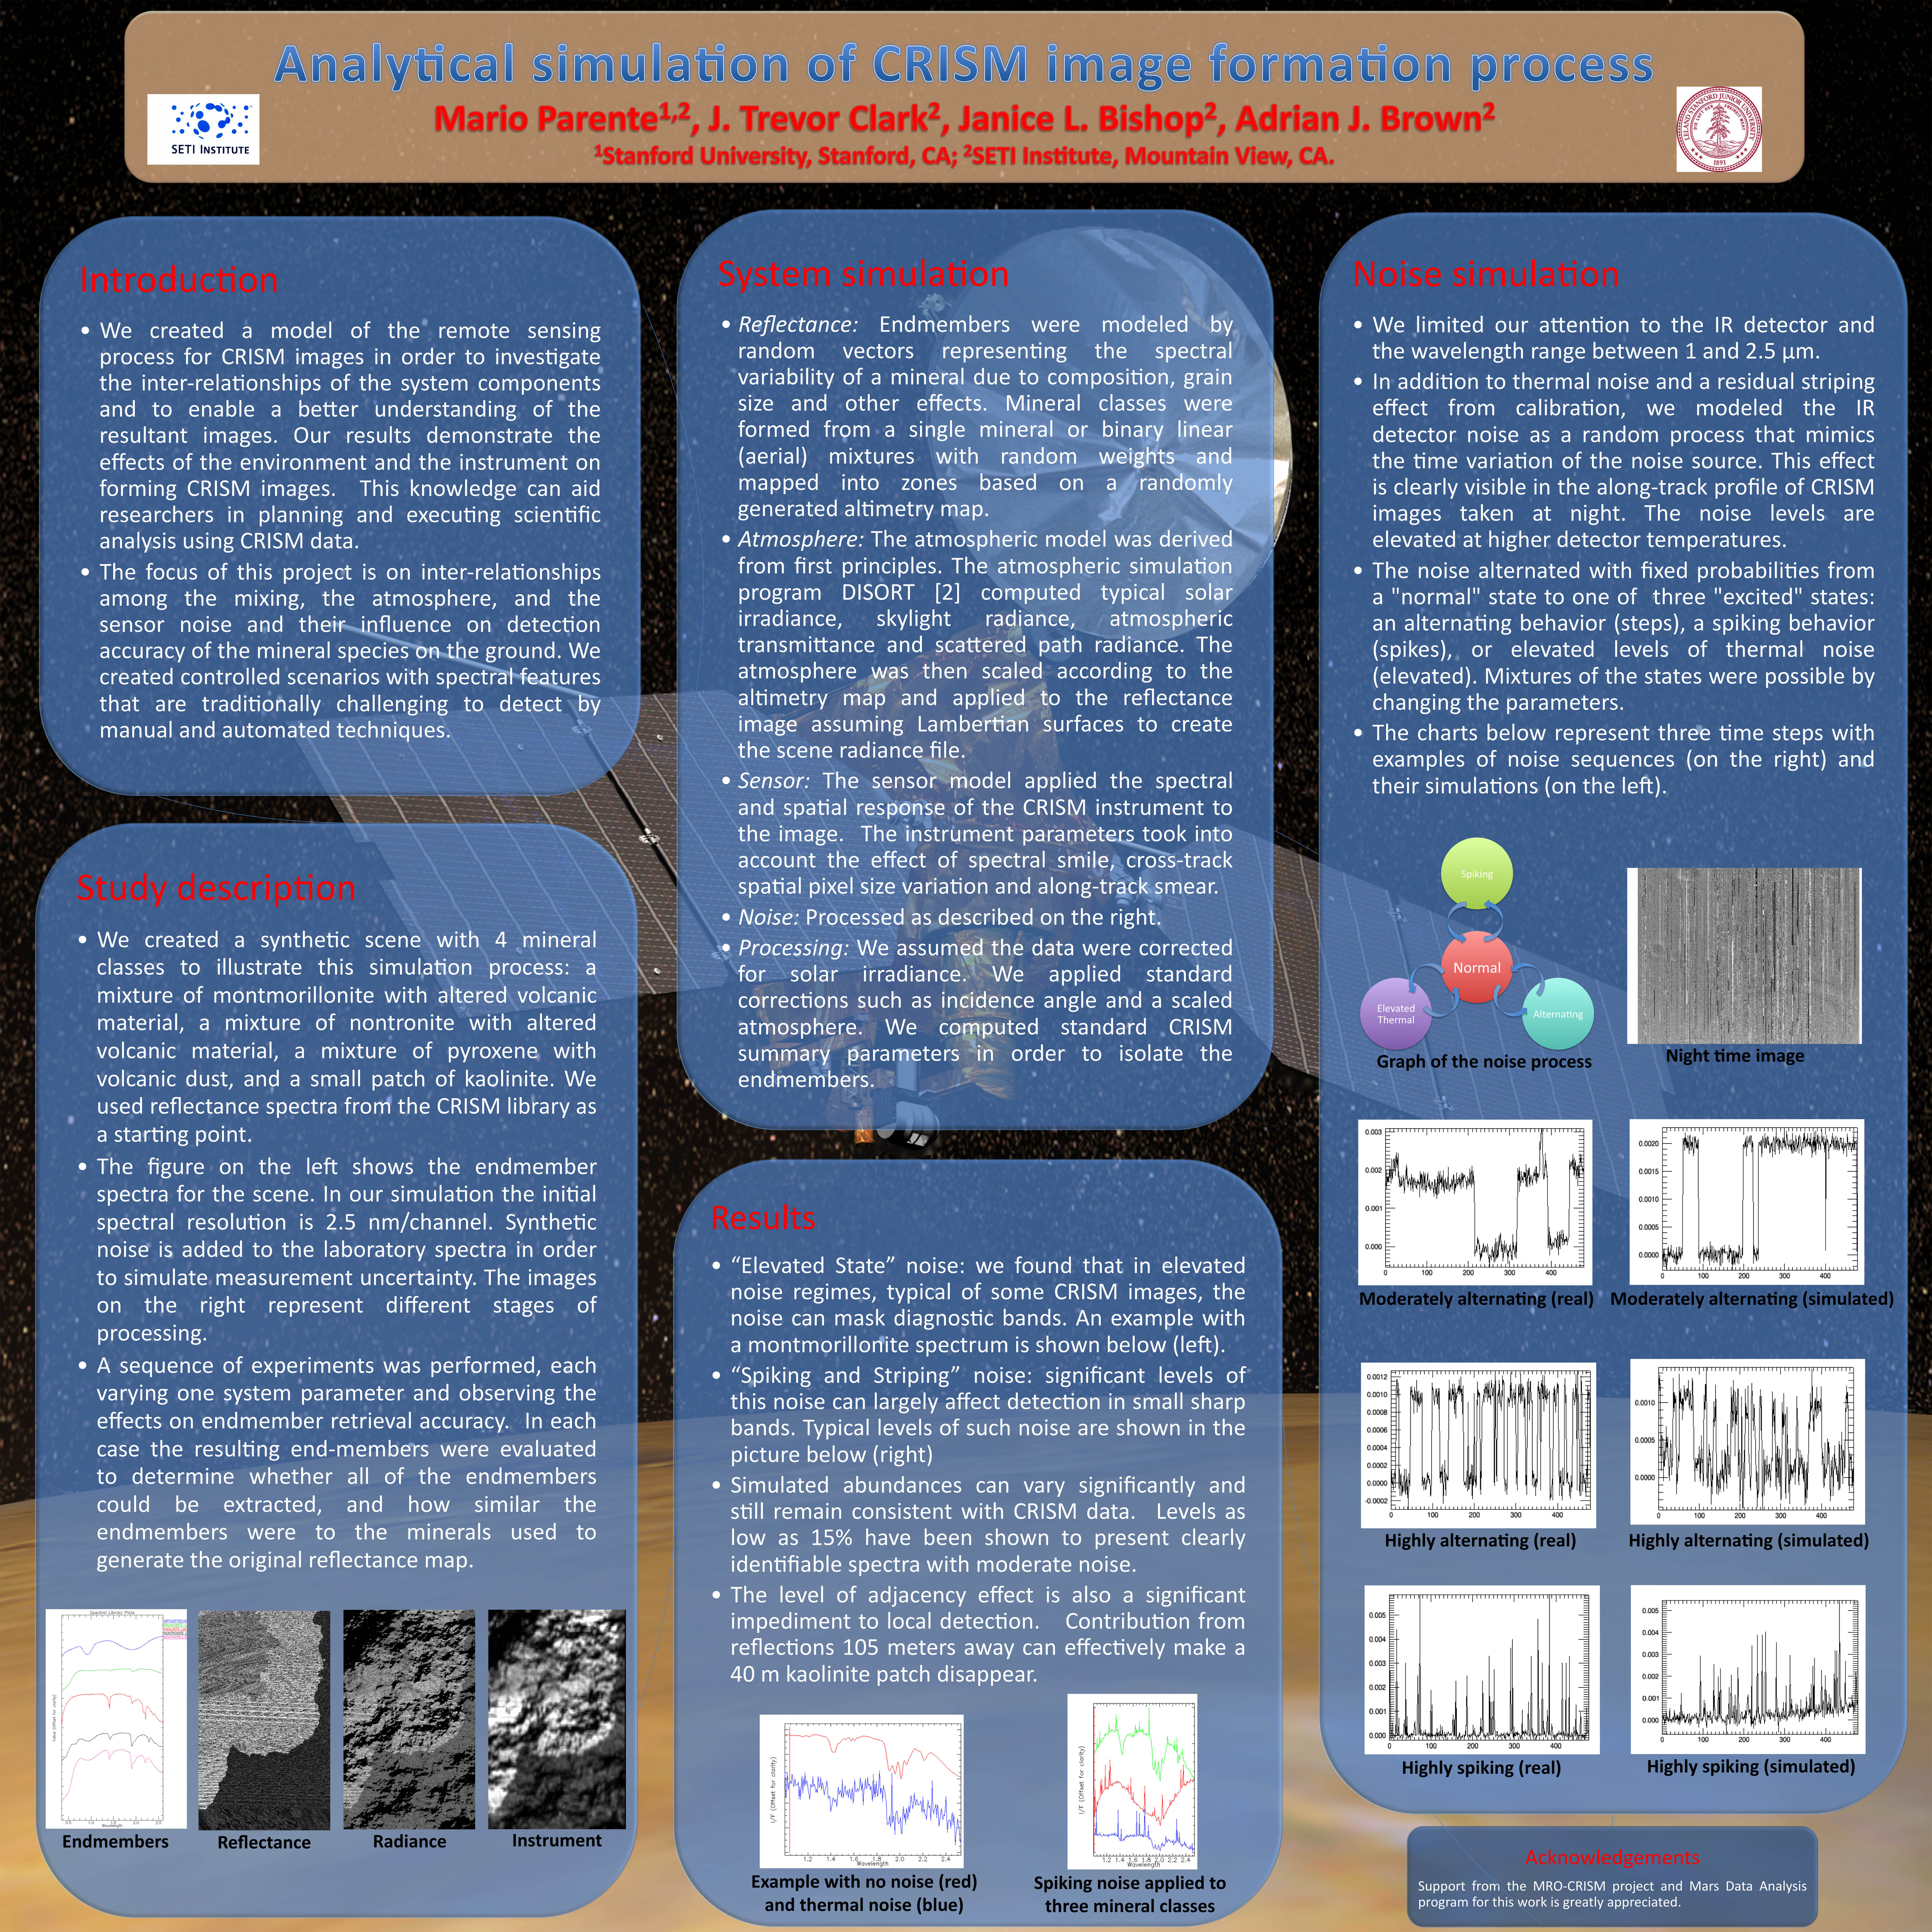
I spent my first summer with the team as an intern / student researcher, modeling Martian atmosphere. We want to focus on the surface of the planet, so we factored out the atmosphere and the spectral contributions of our light source, the sun. Around the time I graduated, I was invited to help the team further. In particular, we needed to improve the image processing pipeline to deal with the failure of a critical cooling system on MRO. The cooler failure resulted in equipment running much hotter than intended, and introducing lots of different types of noise into our data. Mario and I were put in charge of de-noising the images. We did a lot of work breaking down the hyperspectral data cubes and finding statistically relevant ways to remove noise in 3D. In fact, we did so well that there was initially some doubt about whether we had smoothed out too much of the real information as well. We hadn't, but we'd have to build an end-to-end simulator to prove it.
Ultimately, we were interested in maps of spectral results...but it is difficult to prove whether real signal is being removed.
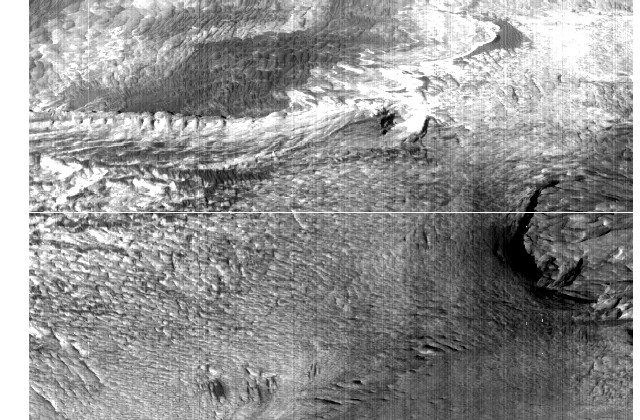
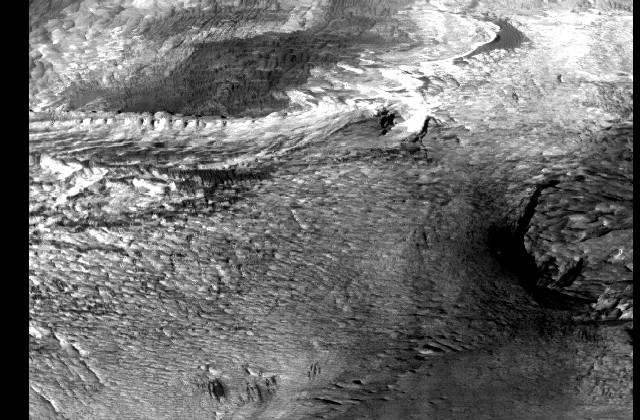
A few more examples:
Analysis
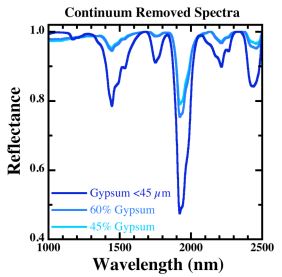
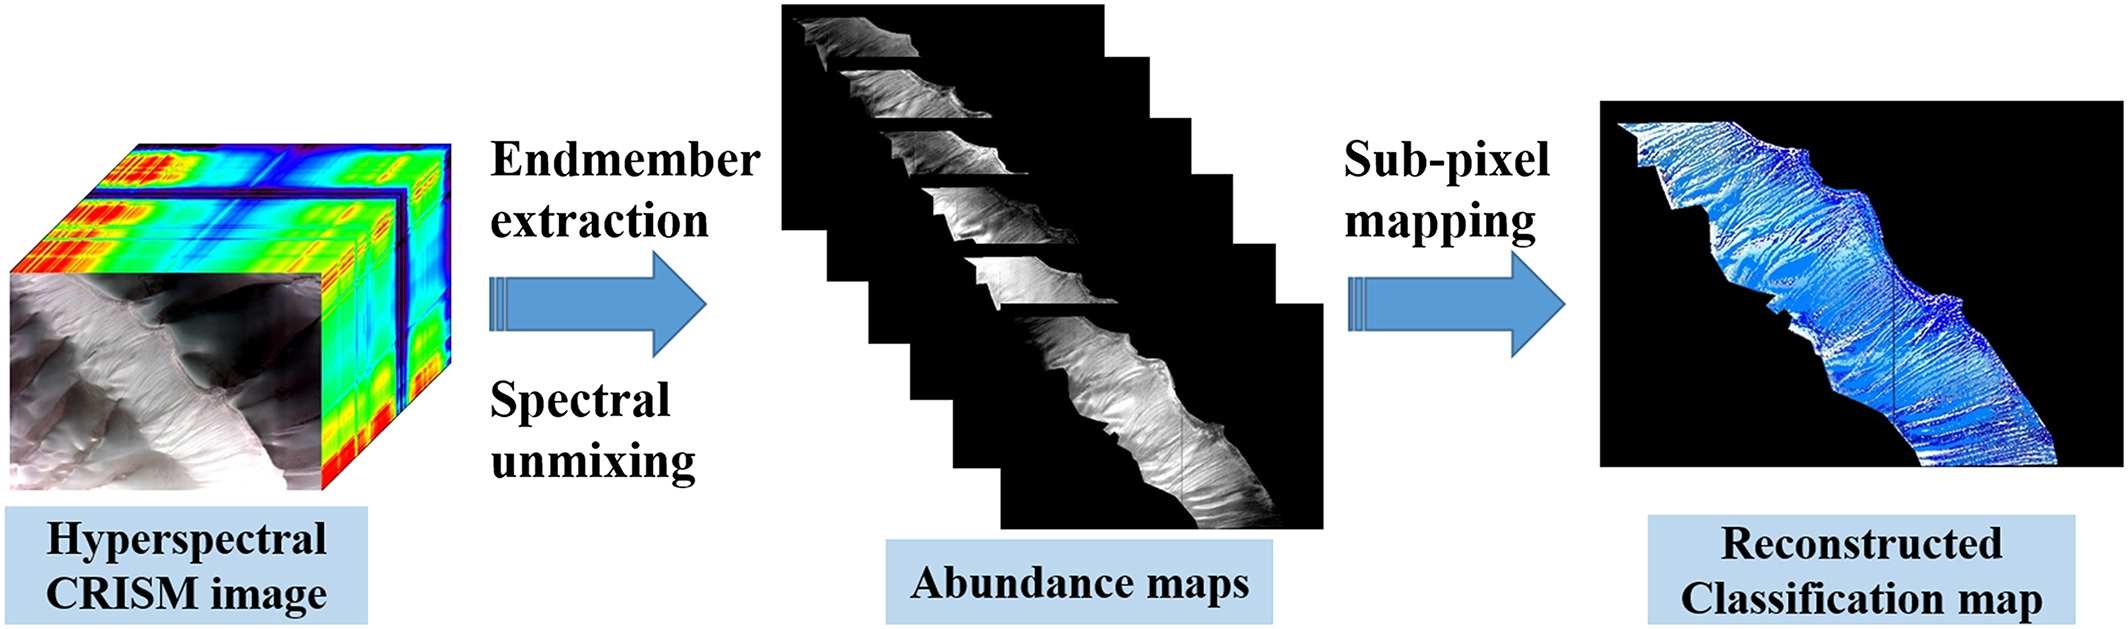
The second part of our work was analyzing the results, and writing filters to determine what minerals were present. Some of these were manual, mostly ratios of different channels that indicate the presence of certain minerals. More advanced models used machine learning techniques to help reduce the dimensionality of data, and cluster it into different mineral groups. We would often study pure minerals (called endmembers), as well as minerals in different abundances. Then we would analyze the images, trying to determine how much of each mineral had contributed to create the spectral signatures we saw.
Simulation
When we believed we had detected minerals, we had no way to verify our analysis, short of sending prohibitively expensive follow-up missions/landers take a closer look. We had no source of ground truth to label our data, and no way to assess the quality of our results. So we built a way! Starting with spectral signatures found in the lab, we simulated high resolution maps (80GB) of Mars-like terrain. Then we generated fractal elevation maps, applied realistic lighting, and atmosphere contributions. Then we simulated CRISM, taking into account the responsiveness to various wavelengths, as well as various types of noise that we had been able to isolate and explain (largely due to temperature dependencies in the sensors. I knew we had done well, when our Principal Investigator walked by one day, saw one of our simulations, and asked what region we were mapping.
Validation
The model was exceptionally realistic, and once we had it, we knew the ground truth of pseudo-Martian terrain. We used that to prove that our denoising tools were accurately removing noise, and inferring the real information. Some of our denoised data had looked a little too good, and this data finally allowed us to verify that we were in fact recovering real data, rather than just smoothing away signal along with the noise. We were also able to start validating our analysis, and showing how good various detection tools were. This work was quite solid, and we won best paper at the very first IEEE WHISPERS (Workshop on Hyperspectral Image and Signal Processing: Evolution in Remote Sensing) conference.
Publications
- Analytical Simulation of CRISM Image Formation Process
- Constraining_Sulfate_Abundance
- Simulating CRISM Images: A Tool For Researchers in Testing and Confirming Geologic Analysis of CRISM Images of Mars
- End-to-End Simulation and Analytical Model of Remote-Sensing Systems: Application to CRISM
- Simulation of the image generation process for CRISM spectrometer data